Businesses are creators who are actively finding solutions to optimize their reach to their targeted audience. While social media has provided them with great opportunities, Instagram is making some serious advancements.
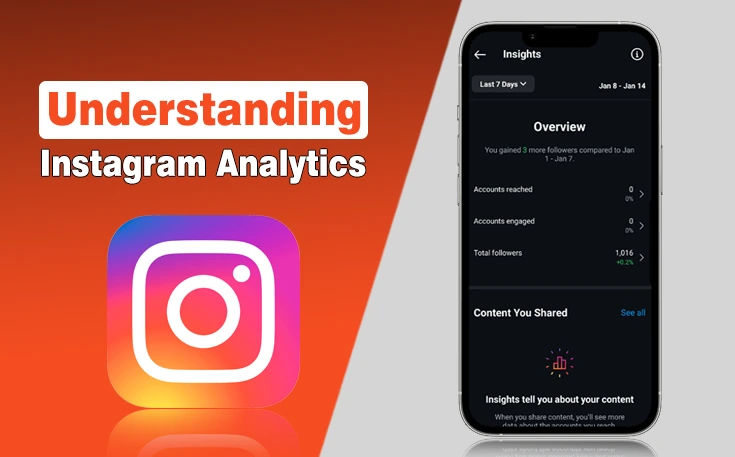
Instagram Analytics are now there that help you understand the demographics of users. Besides metrics like followers and likes, you can now determine what Instagram views tell you about your audience. Understanding your Instagram analytics provides valuable insights that can help you improve your content strategy and improve engagement.
What Total Views on Instagram Tell?
Your total views indicate the overall reach of your content. This encompasses IG views of your photos and videos in feeds, stories, reels, and more.
A high number of views signals that your content is resonating with users and appearing on Explore pages and hashtags. You should know that the views of any Instagram story viewer are not counted in the total views of Instagram.
It also suggests that you have been successful in promoting content across Instagram surfaces. Analyzing trends in views over time can reveal how impactful your recent content has been.
- Have you seen an uptick or decrease in views?
- Did a specific type of post-drive more traffic?
Use this information to double down on what’s working and switch up what’s not.
Feed Post Views
Feed views relate specifically to views of your standard Instagram posts. Since the feed is still the most prominent Instagram real estate, optimizing content for the feed is crucial.
Top-Performing Posts
Sort Instagram posts by views to uncover your top performers. Look at engagement metrics like likes and comments on these posts in addition to views. Your most viewed posts should inspire the type of content you create in the future.
Dive deeper by considering:
- What types of posts get the most views? Certain post formats, like carousels, tend to drive higher engagement.
- Do views correlate to when you post? Your audience may be most active at certain times of day or days of the week.
- Do collaborations and guest posts attract more views? This can help inform your influencer marketing strategy.
Low-Performing Posts
It’s just as important to analyze your least-viewed posts. Ask yourself:
- Were these posts off-brand or off-topic from your niche?
- Were they lower-quality or featured less aesthetically pleasing imagery?
- Did they lack clickbait headlines and captions to entice engagement?
Use insights from your less successful posts to refine your approach and double down on proven strategies.
Stories Views
With 500 million daily users, Instagram Stories represent a growing aspect of the platform. Tracking story views reveals how well you’re leveraging this engaging, ephemeral content.
Take a look at:
- Which individual stories receive the most views? This can determine the types of stories your audience prefers. Examples include behind-the-scenes, educational clips, user-generated content and polls.
- Your best-performing days/times for stories. You may notice more views during weekdays or weekends if you have a business account.
- Average overall views per story. Benchmark this metric and try to increase it over time.
Also, consider cross-promoting your best-performing stories as posts on your feed. Repurposing this content can help you maximize views.
Reels Views
Instagram Reels has quickly become a popular way to create entertaining short video form content. The built-in editing tools make it simple to compel lingels anyone to make Reels, a highly effective way to create social media content. And the potential to be featured on Explore gives Reels vast reach.
When evaluating Reels metrics focus on:
- Your most-viewed Reels. Just one viral Reel can hugely impact your views and followers. Spotting trends among these wins can lead to replicating their success.
- View duration. Especially for entertainment-focused Reels, higher view duration indicates you’re keeping viewers interested.
- Traffic sources. Reels can drive views from Hashtags, Explore and your Profile. See which areas perform best to guide promotion tactics.
Advanced Instagram Analytics
As I mentioned, Instagram has made some serious efforts to let you know about as much as possible about your audience. Besides Facebook Creator Studio, you should also take them into consideration. In this way, you can create high quality social media content. These advanced Instagram analytics are below:
Audience Retention
Want to know if you’re gaining or losing followers over time? Audience retention rates provide the answer. This percentage indicates how many new followers you retain week-over-week compared to losses.
Ideally, you want to see a high audience retention rate. This means your content strategy compels viewers to hit “Follow” after engaging with your profile. It also suggests you offer enough value to prevent current followers from churning.
If your retention rate declines, revisit Instagram’s best practices:
- Post consistently high-quality, on-brand content.
- Utilize relevant hashtags to increase discovery.
- Engage with your audience by replying to comments/messages.
- Promote posts and drive traffic to your profile.
Boosting retention stems from understanding your audience’s interests and nurturing that relationship.
Source of Views
Your audience composition and content tactics promotion where determined views originate. Getting views from Hashtags and Explore is ideal, as these indicate you’re reaching new audiences beyond just your existing followers on social media platforms.
However, viewing profiles remains important as well. This shows your followers regularly engage with the content you share. Driving profile traffic requires staying top-of-mind through fan notifications and compelling captions/visuals that entice clicks.
Evaluating changes in view sources over time can reveal whether you’re expanding your reach or overly relying on followers. The key is striking the right balance between widening your audience and serving those already following you.
Engagement Rate
While raw view counts provide helpful context, engagement rates indicate how well your content actually connects with viewers. To calculate your Instagram engagement rate, add your likes and comments and divide this number by the total views.
Higher engagement rates demonstrate you’re creating viewer-resonating, response-worthy content. This also suggests genuine user interest rather than inflated views from bots or purchased followers.
As you grow your following, maintaining engagement becomes more challenging. However, optimized content tailored to your audience’s preferences can help you overcome this challenge.
How Instagram Analaytics Let You Learn Audience Interests?
Your followers list provides the foundation for analyzing audience interests. Instagram analytics tools source first-party data based on the accounts engaging with you.
Key indicators of audience interests include:
Follower Demographics
Details like age, gender and location help segment who your followers are. Identifying these attributes then enables the creation of targeted content. For example, developing posts, products, or offers that appeal specifically to women ages 25-34.
Audience Affinities
Affinity categories group followers based on inferred interests and behaviors. High affinities for “Health & Fitness” or “Fashion & Style” spotlight the topics and content types driving follower growth and optimize your digital marketing strategies.
Branded Content Tags
When creators tag brand partners in their posts, this signifies an official partnership. Gaining many of these brand tags suggests your audience aligns with those brands. The specific industries and products highlighted here provide more insight into the audience.
Referral Traffic
This encompasses clicks from external websites, links in bios or sites embedding your posts. Referrals demonstrate how you’re successfully driving Instagram traffic from outside channels.
Paid Traffic
If running Instagram ads, paid traffic metrics reveal their impact. Relevant factors are clicks, link clicks, impressions, and reach from ads or boosted posts. Measure this against ad spending to calculate ROI.
Organic Traffic
Organic traffic comes from non-paid discovery on Instagram. This includes views from hashtags, Explore page, or the app suggesting your content. Growing your organic reach not only saves money but also shows genuine user interest.
Location Insights
Your followers’ locations highlight where you may have the biggest on-the-ground impact. A highly concentrated local audience makes coordinating in-person events easier. Meanwhile, broader worldwide distribution increases opportunities to promote products or services globally.
Instagram analytics by country, state, or city answer questions like:
- Which geographic areas represent your largest audience segments?
- How does your local following compare to your worldwide reach?
- Are followers concentrated around specific areas?
Tailoring content to resonate with followers by location can help increase relevance. However, pursuing worldwide growth requires adopting a more universal social media strategy.
Audience Behavior Insights
Advanced analytics platforms provide additional context into follower behaviors. Hence, you can personalize your content to build trust with them. Important behavior insights are:
- Account Type. This reveals whether you’re reaching more personal consumer accounts or business/creator accounts. Catering content specifically to one audience type may increase views and engagement.
- Follower Loyalty. Metrics tracking how long accounts have followed determined your audience loyalty. Long-term, consistent followers signify you’re effectively keeping fans engaged. Meanwhile, quick follower churn means struggling to retain audience interest.
Instagram Analytics annd Competitor Benchmarking
While the focus should remain on your own Instagram strategy, analyzing competitors’ accounts can provide useful benchmarks.
Aspects to compare include:
- Follower Count.
- Engagement Rates.
- Views.
- Content Themes/Formats.
- Posting Frequency.
This competitive analysis may reveal areas where you excel or fall behind. Use these insights to double down on your differentiators while improving upon weaknesses.
Key Takeaways
Getting more views is a core pursuit for brands using Instagram marketing. But simply driving views shouldn’t be the end goal. Understanding metrics in context provides actionable direction for attracting and engaging your target audience.
Consistently analyzing Instagram analytics aids longer-term business objectives like:
- Increasing website conversions.
- Growing email lists.
- Boosting sales revenue.
So rather than obsessing over vanity metrics, let data guide your audience-building and platform-optimization efforts. With the right analytics approach, the views will come, and your Instagram presence will thrive.
Final Thoughts
These are the details about the Instagram Analytics and how you can understand them to optimize your reach to a wider audience. In this way, you can get the complete advantage of social media platforms to get all the possible results.
Learn advanced analytics and determine the demographics of your viewers. Check your reels and posts which are getting more likes. These are the content you want to promote. You can also utilize the potential of paid marketing for more reach.
Need custom app with amazing features?
Get a Quote
